The DNA Visualizer tool for feature exploration on SequenceServer
What is the DNA Visualizer?
The DNA Visualizer serves as a valuable tool for the annotation process for genomes, plasmids and other DNA sequences. Leveraging Bakta (Schwengers et al, 2021), SequenceServer simplifies the annotation workflow, allowing you to analyze your data quickly.
Annotation involves the identification and labelling of DNA features such as, genes, regulatory elements, and functional components like binding domains of protein-coding sequences. Bakta is capability of discerning known identical protein sequences (IPS) sourced from RefSeq and UniProt, as well as small proteins/short open reading frames (sORF). Beyond protein annotation, its functionality includes the identification of non-coding RNA, cis-regulatory regions, oriC/oriV/oriT, assembly gaps, and a range of features such as tRNA, tmRNA, rRNA, ncRNA genes, CRISPR, CDS, and pseudogenes.
DNA Visualizer is accessible to SequenceServer’s cloud users, located at the top and bottom of the BLAST interface page.
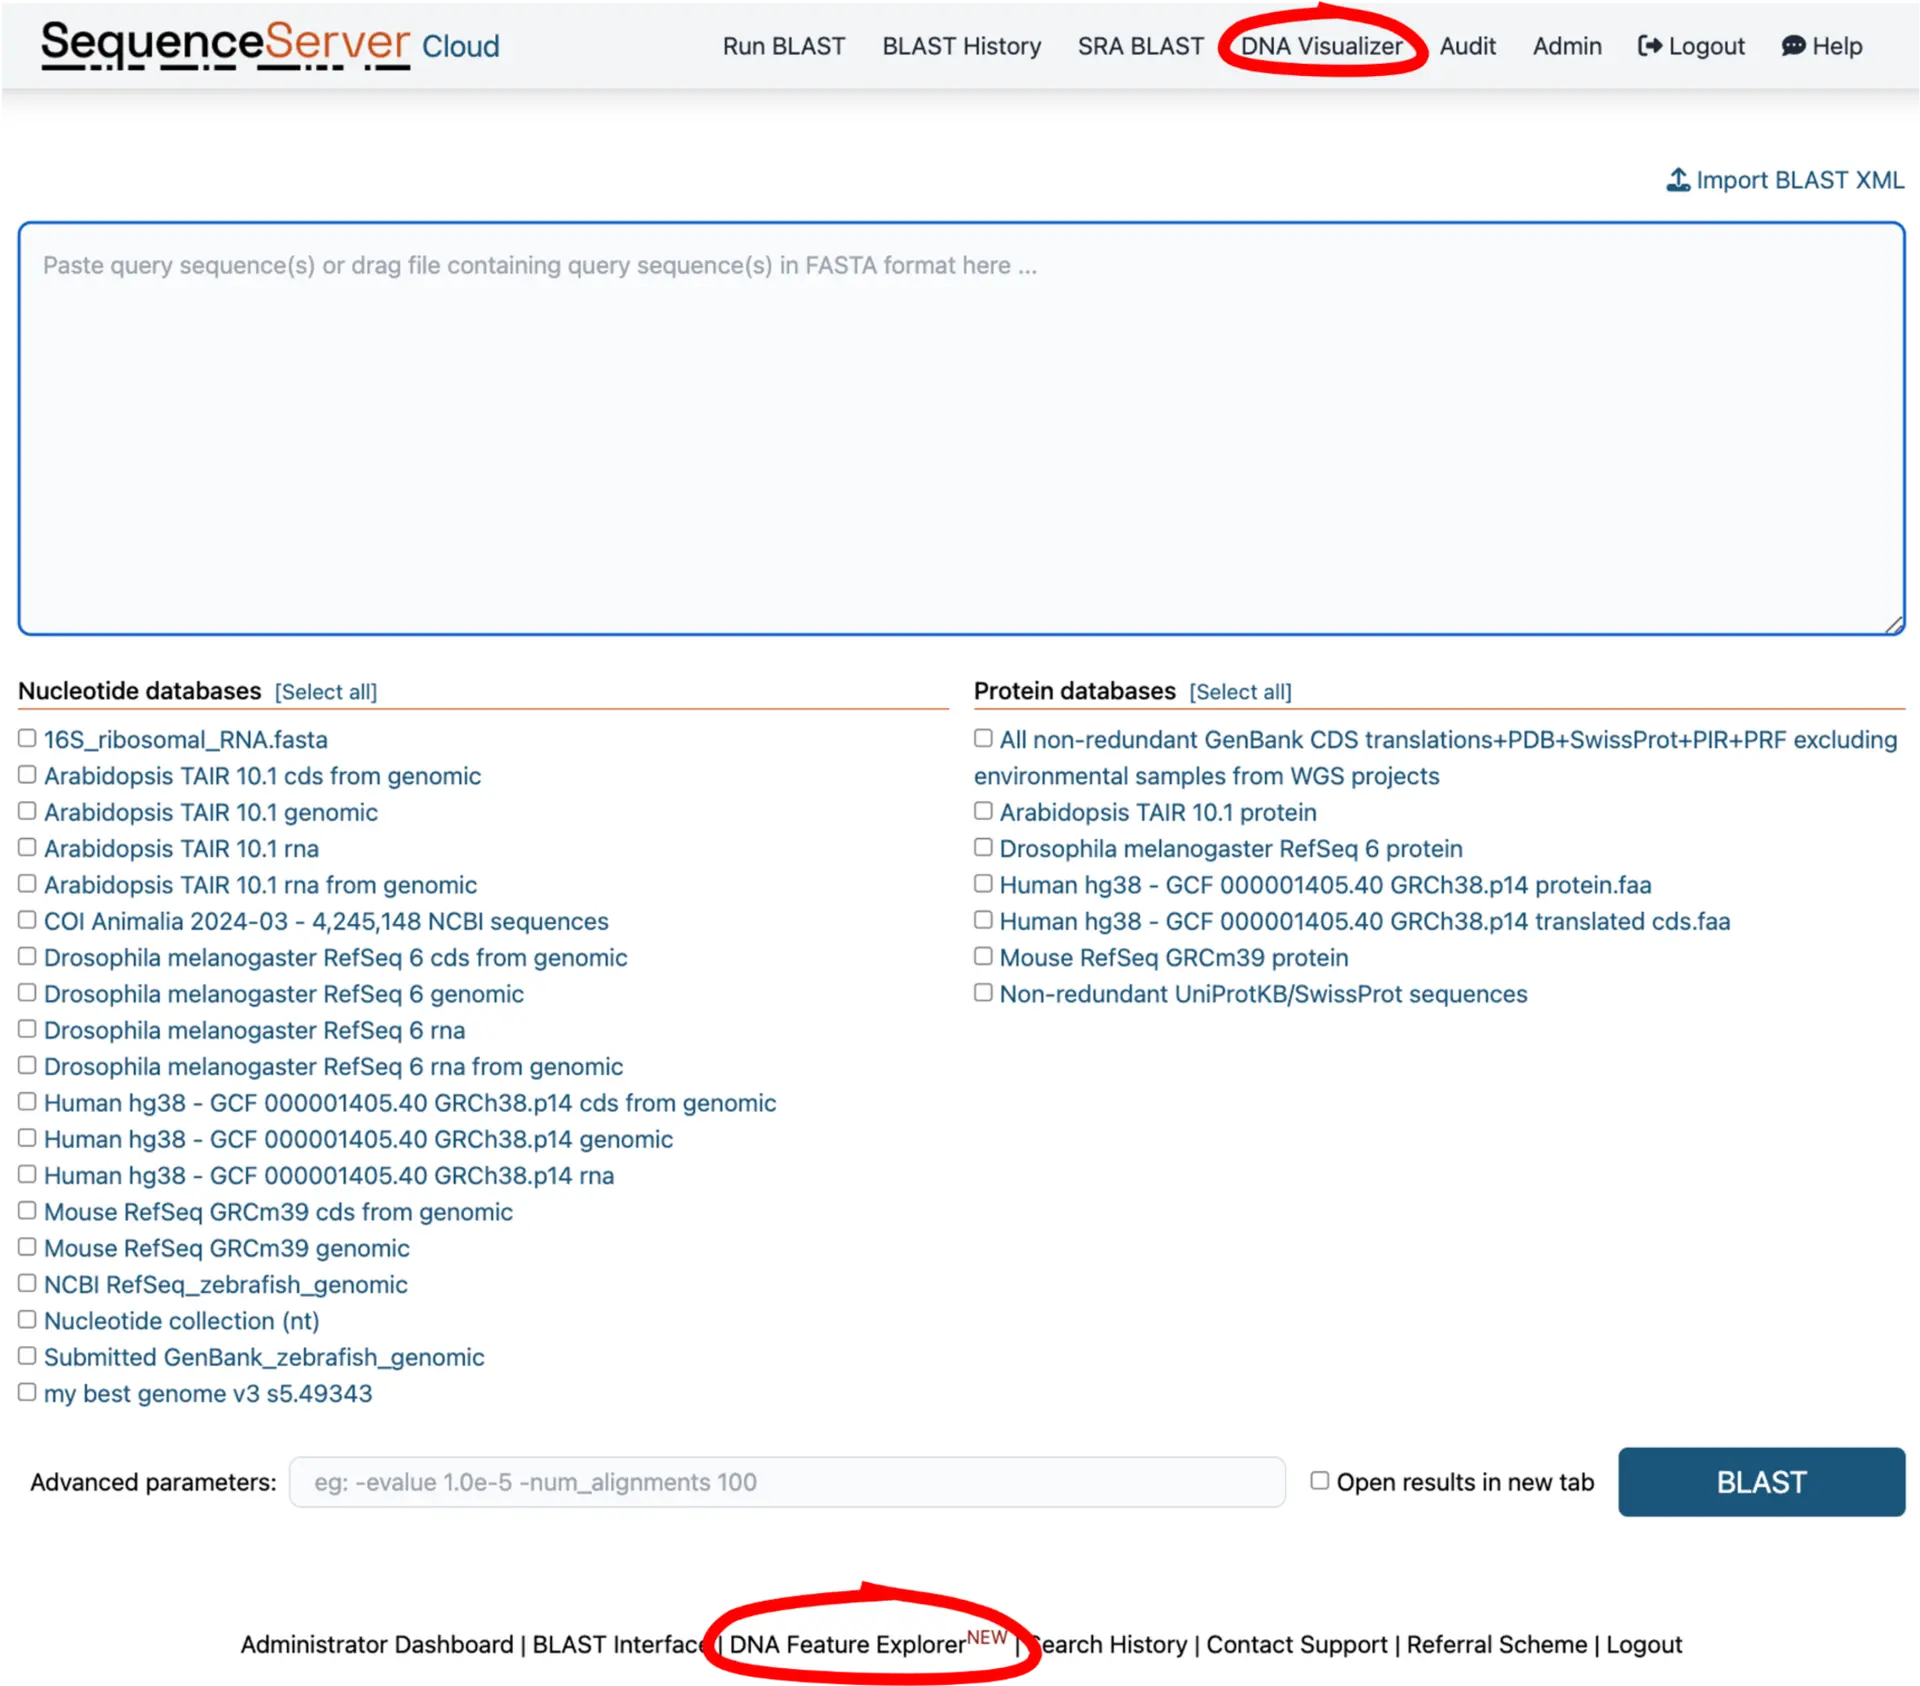
FASTA DNA sequences as input for genomic feature annotation
The DNA Visualizer takes DNA sequences only as input and are copy-pasted into the query box. These DNA sequences can be anything from bacterial genomes, plasmids (complete or draft assemblies) and gene sequences.
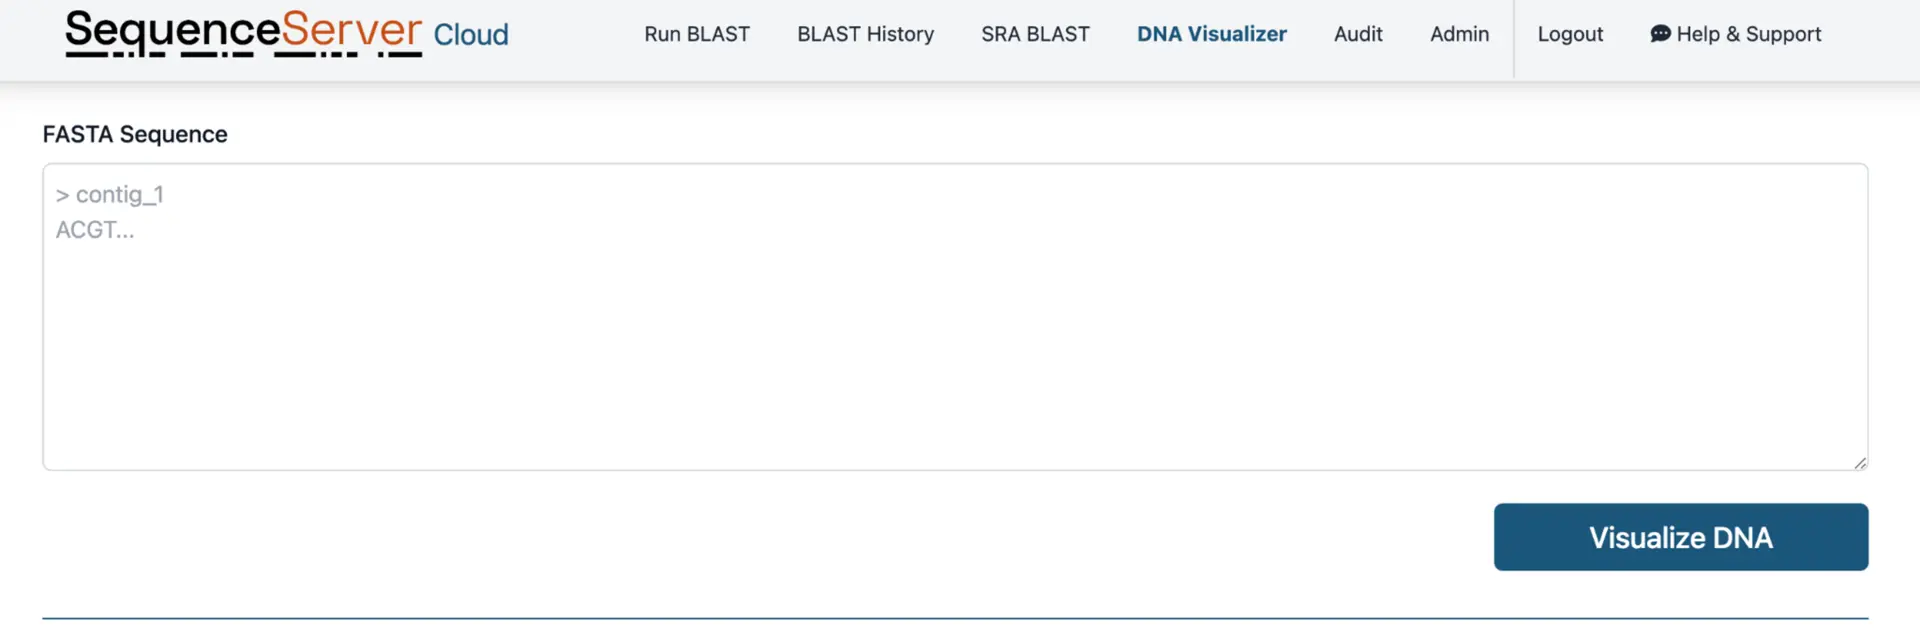
BLASTN output results can be analyzed DNA Visualizer
Alternatively, following a BLASTN analysis through the Run BLAST interface, you can choose to run the DNA Visualizer to analyze your BLAST hits. This can be a powerful way to identify whether your aligned regions possess annotated functionality.

Plasmid and genome feature exploration with DNA Visualizer
Analyzing plasmid features
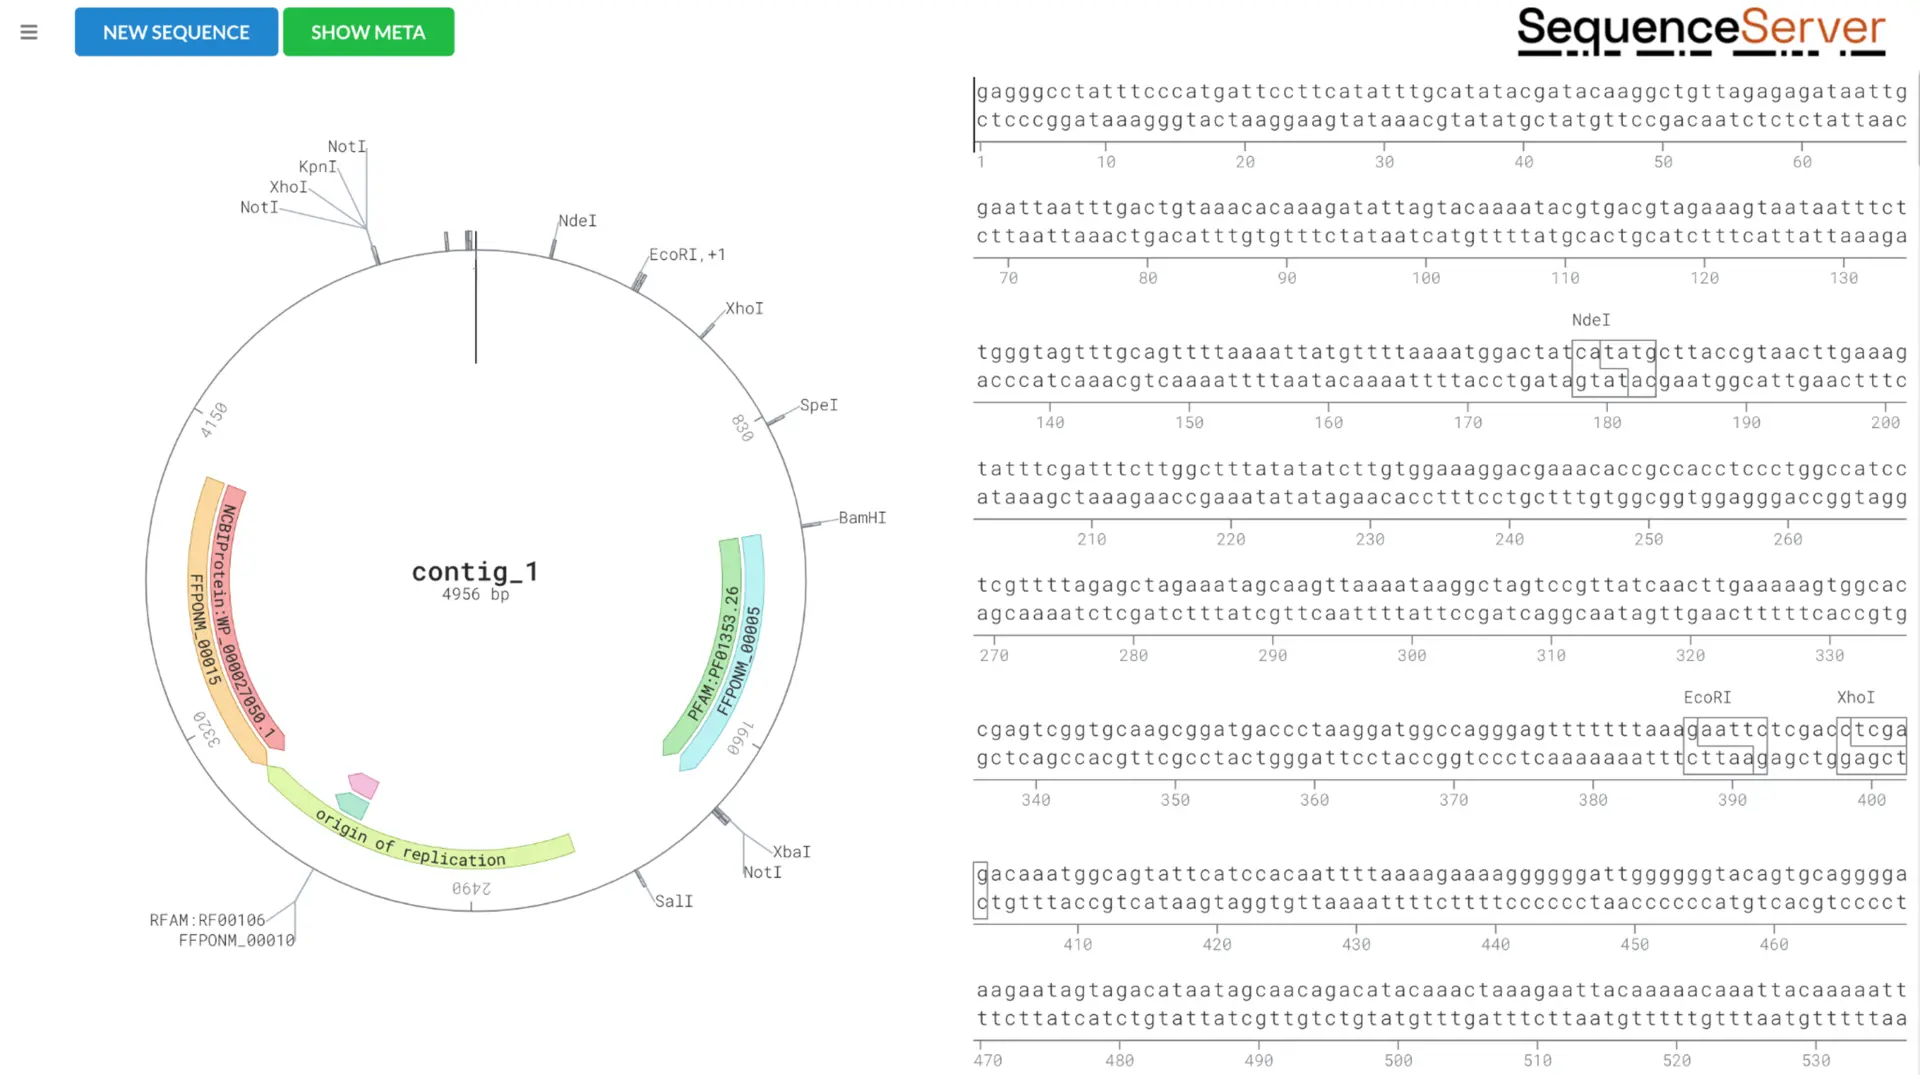
A complete plasmid sequence can be analyzed with DNA Visualizer to annotate and explore various elements. The example below includes a bacterial plasmid containing TEM-116, a broad-spectrum beta-lactamase found in many species of bacteria.
By using DNA Visualizer, in this plasmid we are able to see:
- the gene of interest, labelled as the NCBI protein entry
- elements including green fluorescent protein (GFP) labelled as PF01353.1
- the origin of replication (the sequence where plasmid replication is initiated)
- recognition sites for restriction enzymes (e.g. EcoRI, BamHI, etc).
All this information helps to understand the structure, function, and utility of plasmids in various molecular biology applications, for example:
- cloning
- gene expression studies
- site-directed mutagenesis
- protein production
- purification.
Bacterial genome annotation
The genome annotation process can be a complex and time consuming process. DNA Visualizer makes annotation of bacterial genomes and collection of downstream files simple.
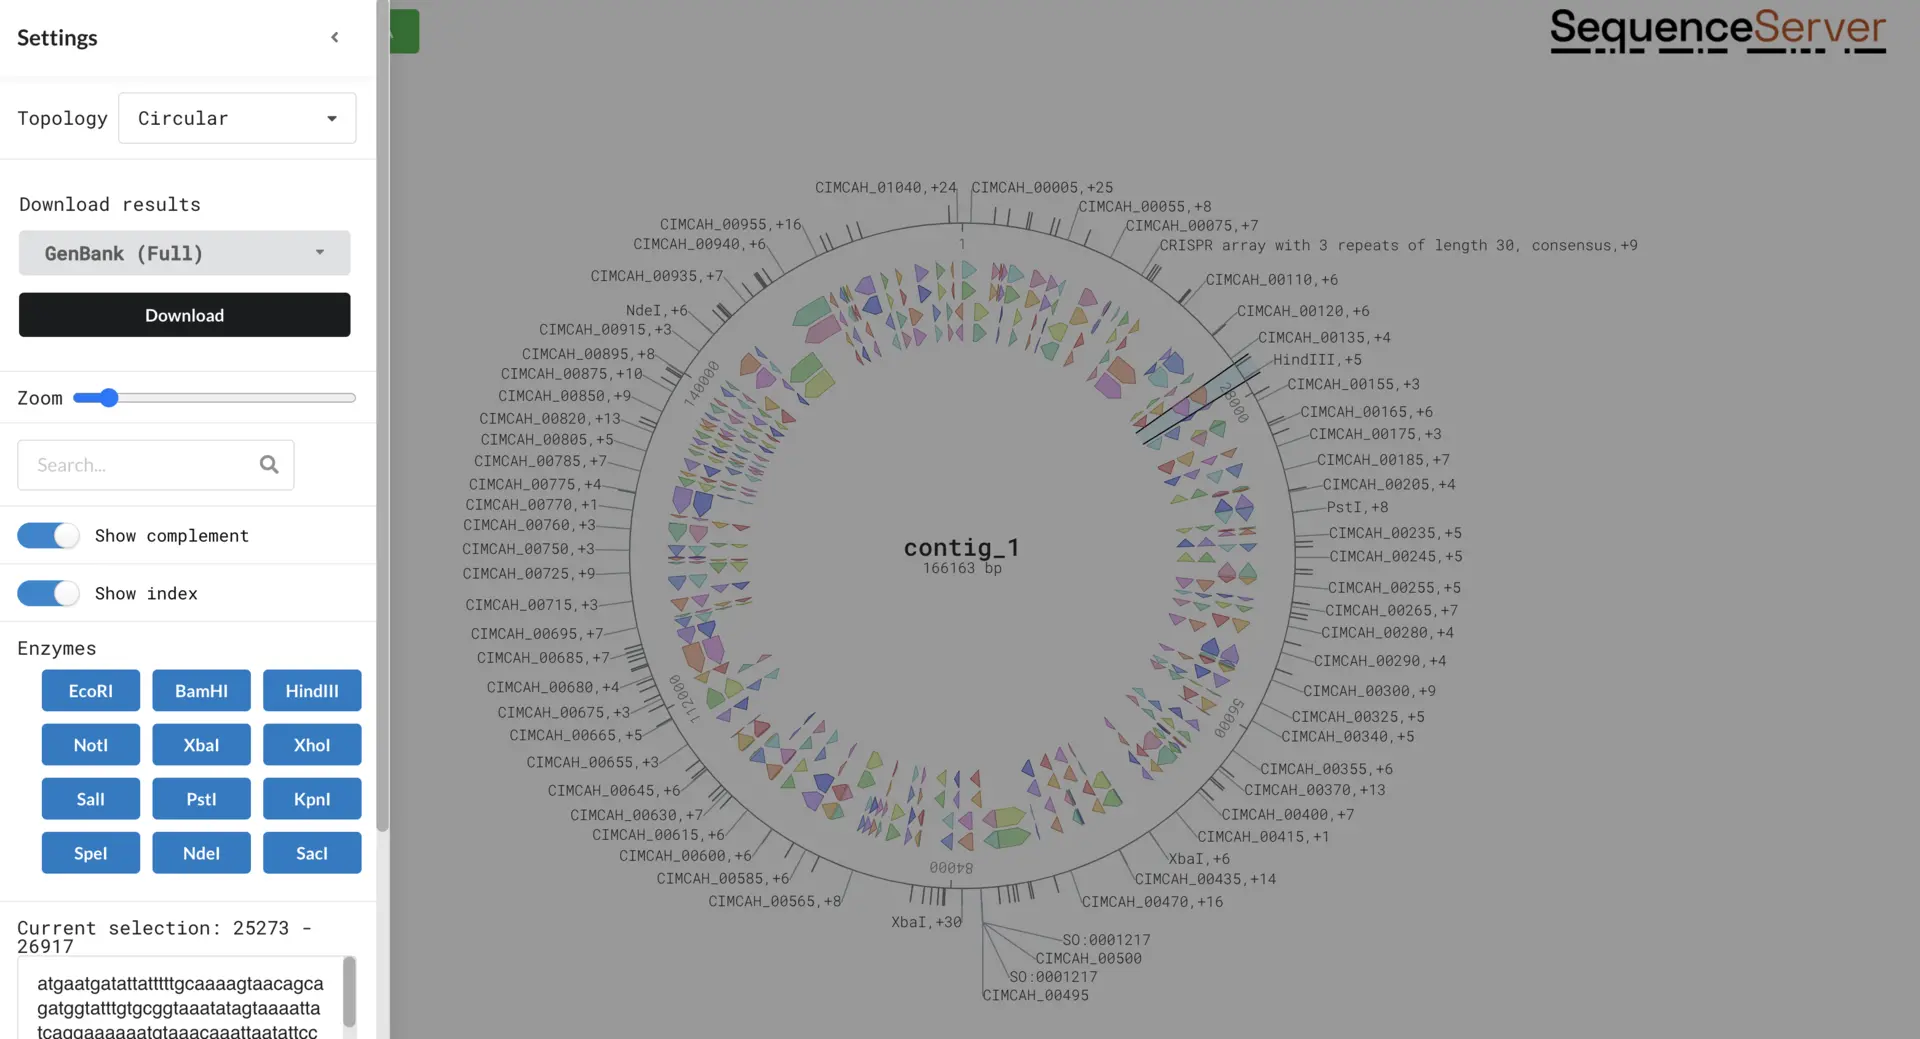
Here we will annotate the genome of the bacteria Candidatus Carsonella ruddii using the GenBank assembly version that has the accession GCA_000287275.1. We can simply paste this genome sequence into DNA Visualizer and annotate the genome. And there it is, an annotated genome! As you can see, many features are annotated, including protein coding genes.
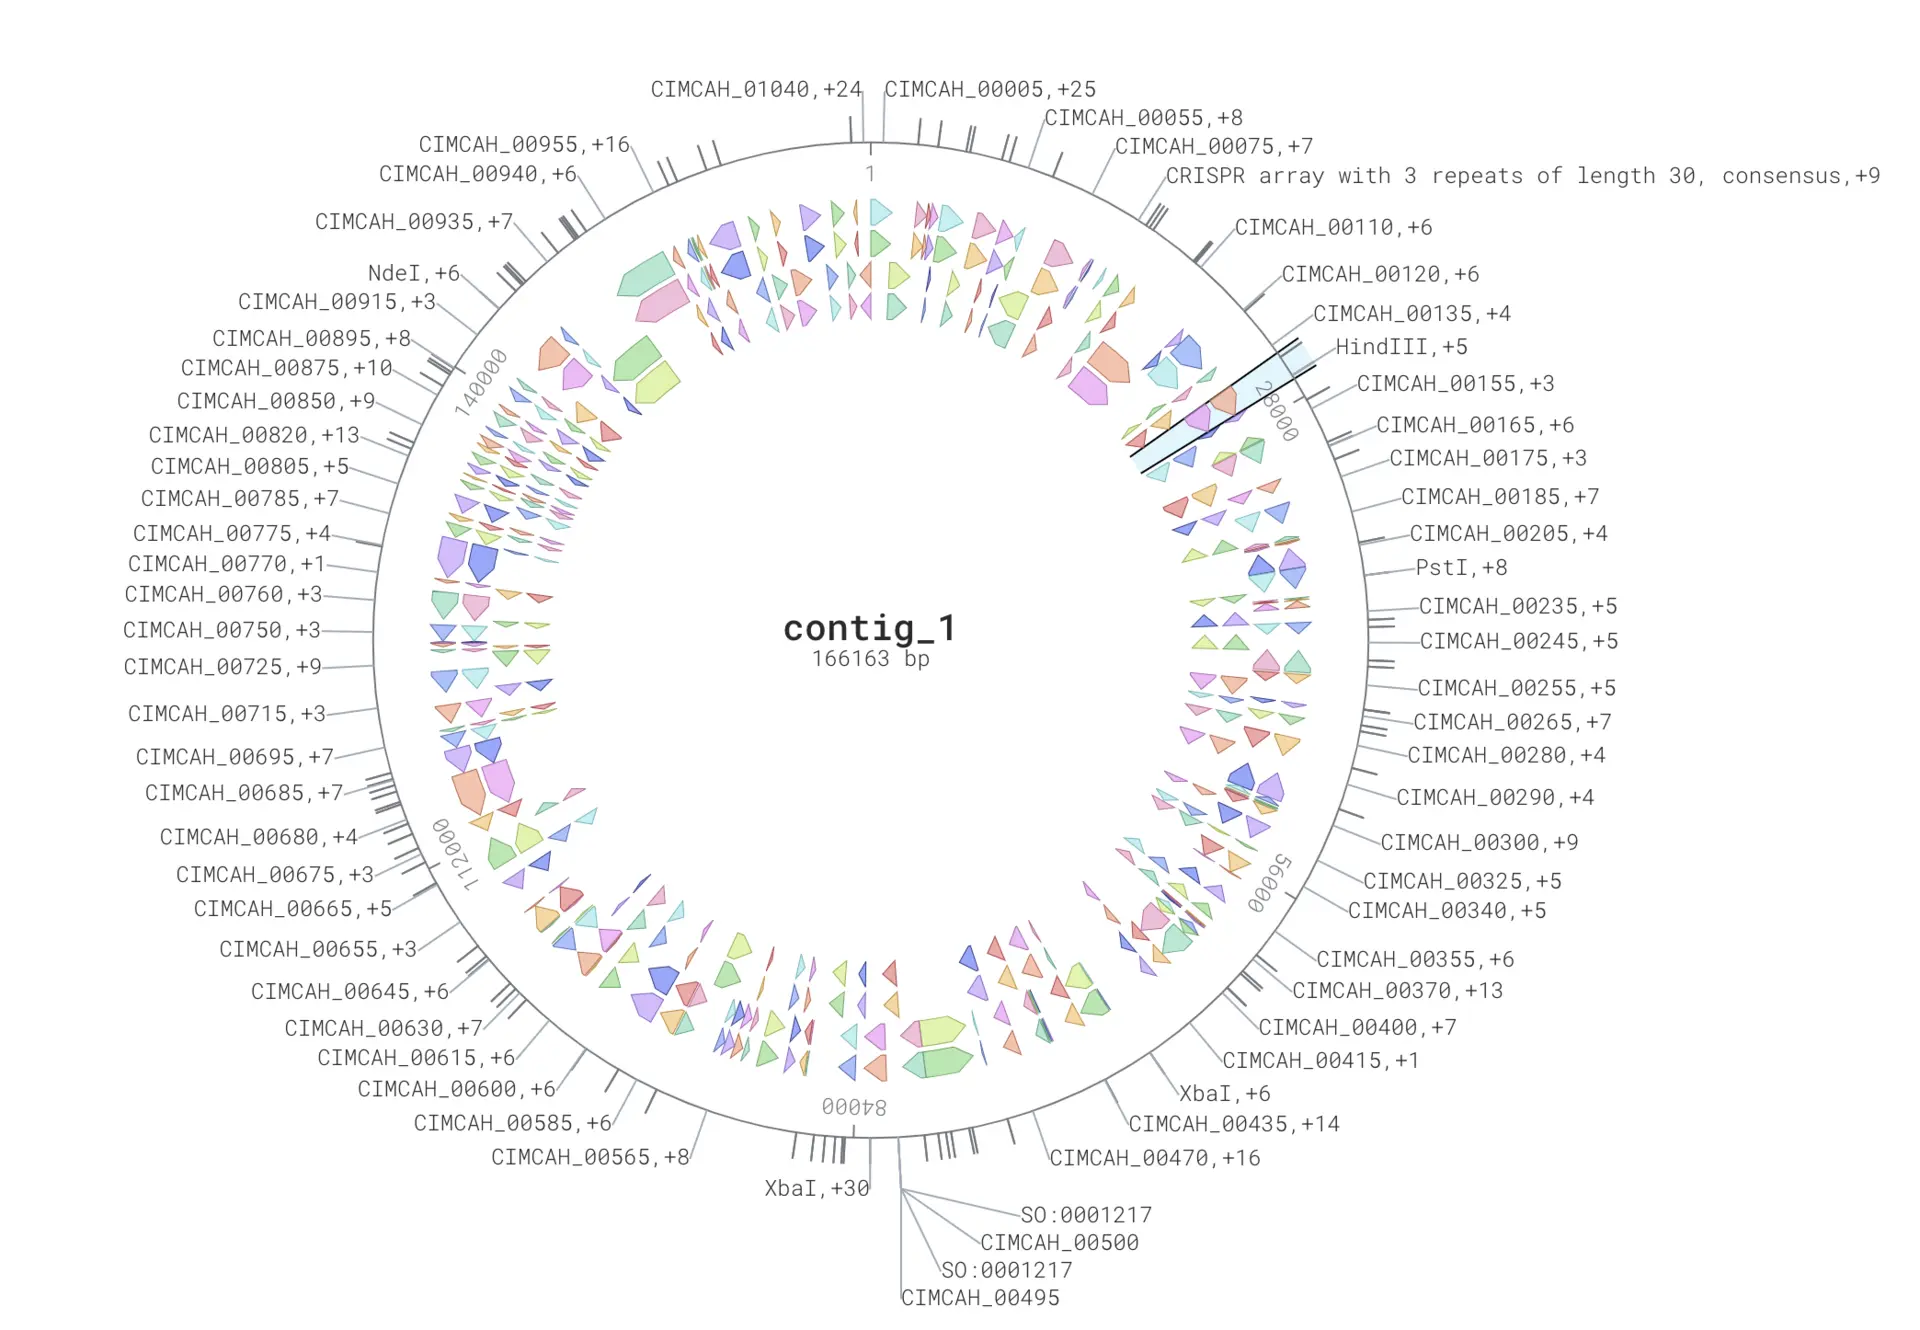
On the left-hand side there is a drop-down menu with a range of options for different visualizations such as circular/linear views, zooming, showing the positions, and both DNA strands. We can also select to download all (or some of) the annotation files. These files are very useful in downstream analysis, for example the GFF3 files for RNAseq read mapping, or the nucleotide and protein FASTA files for creating a custom BLAST database for our new annotation so we identify homology relationships.
Explore DNA Visualizer features output
As mentioned above, DNA Visualizer can also be reached from the BLAST output, which takes you to visualise the hit’s location in the BLAST subject.
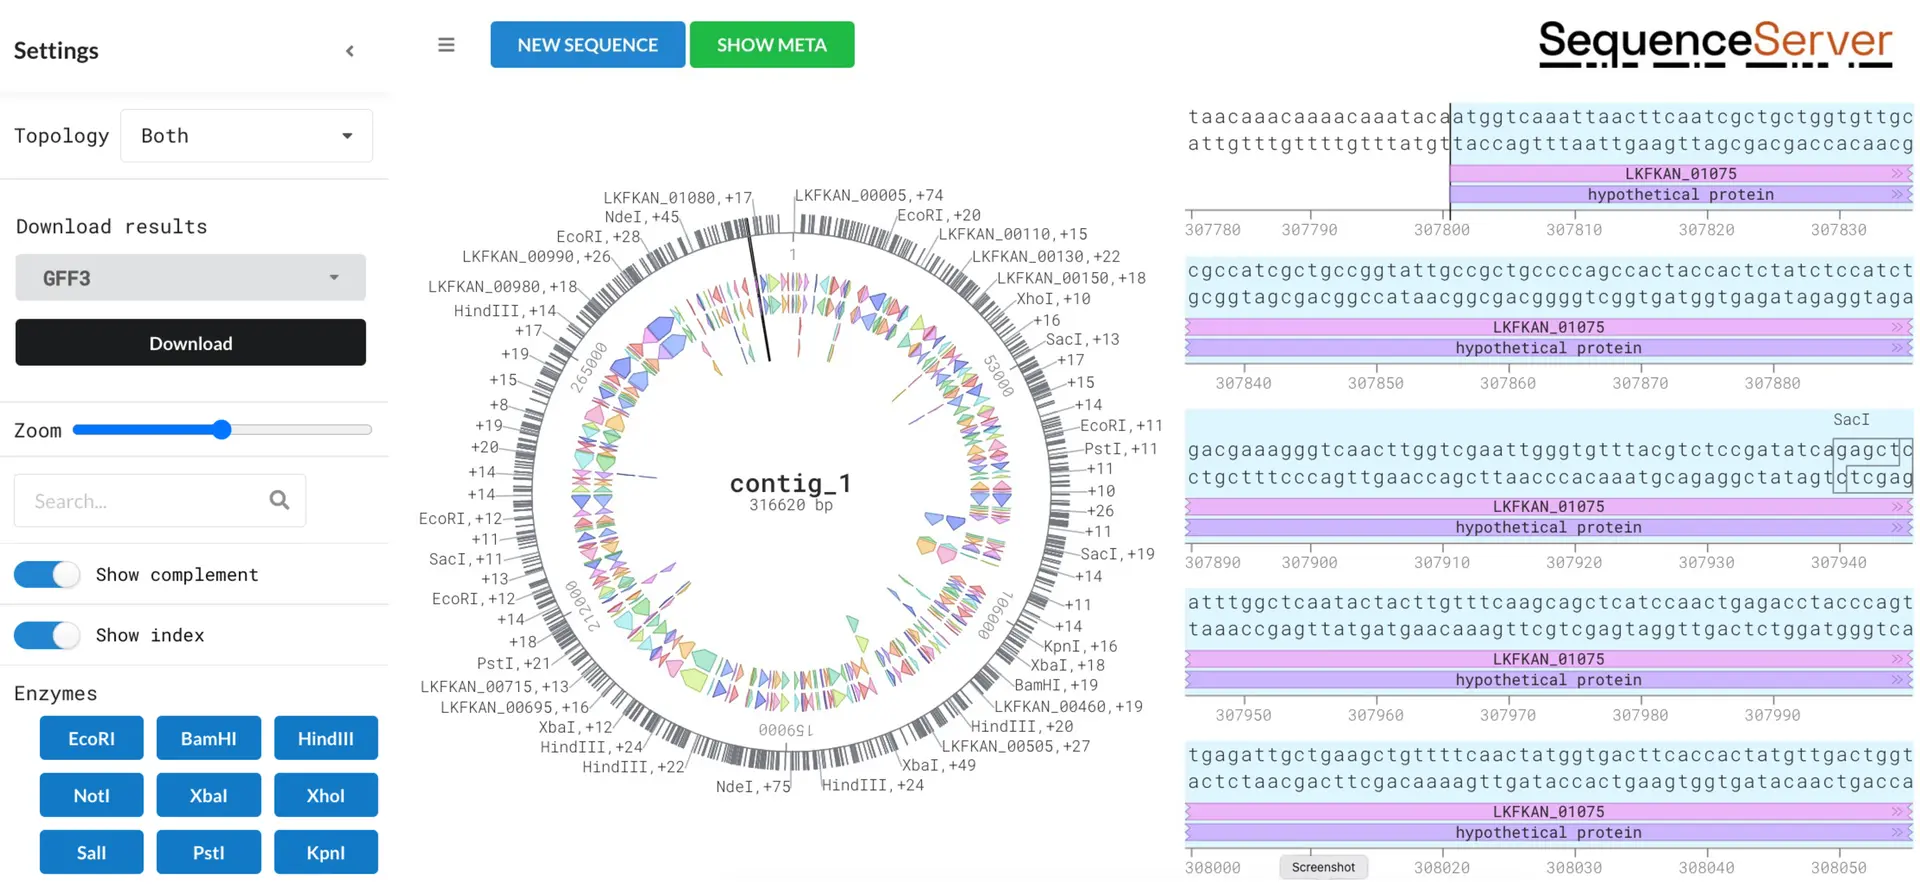
The example below shows the location of the gene Cinnamyl alcohol dehydrogenases (CAD) which encodes an AP-1 type transcription factor within the bakers yeast Saccharomyces cerevisiae located on chromosome III.
This demonstrates another use of DNA Visualizer, assessing the genetic location of a gene of interest which can be advantageous for functional annotation, gene mapping, and comparative genomics to name a few. These annotation features are usually formatted in the GFF3 files, which can be downloaded from the drop-down menu on the left-hand side.
Possible insights with DNA Visualizer
As DNA Visualizer runs a genome annotation/analysis with Bakta, it is able to provide a wide range of insights, such as the following.
- Genome Annotation: It can be used to annotate genomes by identifying and labelling genes, regulatory elements, coding and non-coding RNAs, and other genomic features.
- Metagenome-Assembled Genome (MAG) Annotation: MAGs are genomes reconstructed from metagenomic data, which represent the collective genetic material of microbial communities in environmental samples. Researchers can annotate MAGs to identify genes and functional elements to provide insights into the metabolic potential and ecological roles of microorganisms in environmental or host-associated communities.
- Plasmid Annotation: DNA Visualizer supports the annotation of plasmids, which are small, extrachromosomal DNA molecules often found in bacteria in order to identify genes, replication origins, antibiotic resistance genes, and other features within plasmids. This aids in the characterisation of plasmid diversity, evolution, and spread of antibiotic resistance.
- Visualisation and Interpretation: It also offers visualisation tools and interactive interfaces to help researchers explore annotated genomes, visualise genomic features, and interpret annotation results. Visualisation aids in understanding the organisation and complexity of bacterial genomes and facilitates data exploration and hypothesis generation. These can be downloaded and used, for example, in publications, presentations, and record keeping.
Happy BLASTing!
Schwengers O., Jelonek L., Dieckmann M. A., Beyvers S., Blom J., Goesmann A. (2021). Bakta: rapid and standardized annotation of bacterial genomes via alignment-free sequence identification. Microbial Genomics, 7(11).